 |
|||||||||
|
|
||||||||||||||||||
|
|
| Want to leave us a comment about the site or in general? Click here to access the form. |
 |
|
Workstation Smackdown (Nvidia Quadro DCC review) by: Greg Hess Added on: Mon Feb 04 2002 |
|
| Page: 1 2 3 4 5 6 7 8 9 10 11 12 13 14 15 | |
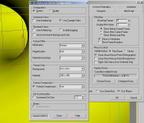
Maxtreme pushes the limits of Space/Time  With maxextreme drivers, you can tweak the properties of the card, including AA features, triangle displays, viewport backgrounds, and adjust the speed of textures/quality. These settings not only let you tweak performance, but can aid in troubleshooting any viewport issues should they occur. (Maxextreme also greatly accelerates 3dsmax, as you will see very soon. The Performance of Nvidia GPU�s in 3D Studio Max R4.2  An explanation on the testing method, along with scene explanations and explanations can be found at: An explanation on the testing method, along with scene explanations and explanations can be found at: The Creation of a Benchmark The Following Cards were tested. (All are 64 Meg variants) Numbers indicate core/mem speed. Geforce 2 GTS (200/333) Geforce 3 Ti 200 (175/400) Geforce 3 (200/466) Geforce 5 Ti 500 (240/500) Quadro DCC (200/466) Software Heidi was used as a baseline of performance. Nvidia reference drivers 21.83 were used, as was Maxextreme version 4.00 for the Quadro. The system used to record these benchmarks is a Custom Workstation with the following critical statistics.  CPU: Athlon 1533 Thunderbird (Not an XP) CPU: Athlon 1533 Thunderbird (Not an XP)Mboard: Iwill KK266+ Memory: 1.0 Gigs of (2x512) 2-2-2 Mushkin branded Nanya chips. Sound: Onboard cMedia Nic: 3com 3C905C Periphals: IBM 60GXP 40 gig, Plextor 32x/8x/4x, LS-120 Superdisk. (Yes that�s my personal system currently.) All tests were carried out as specified in the previous article. Tests were averaged and rounded to the .1 place. There are two main graphs for each result. The one on the LEFT is the time it takes for each particular accelerator to complete the scene in interactive playback, from frame 0 to the scenes final frame. In this test, LESS = FASTER. The graph on the RIGHT is a Frames Per Second graph, found by taking the scores found in interactive playback, and mathematically calculating the average based on the frames in the scene. In this graph MORE = FASTER. Both graphs are present to reinforce the data, and to allow for easy replication of numbers. Some quick answers to commonly asked questions before we get to the benchmarks. |
Best viewed in 1024x768 or higher,
using any modern CSS compliant browser.